
Explaining Oregon Property Taxes
Taxes in Oregon present an interesting balancing act. Some are high, others are low, and some tax laws can be confusing. We’re one of five states with no sales tax. In fact, Oregonians have rejected the introduction of a sales tax nine times. We also have a “kicker law” which doesn’t allow the state to have a surplus in tax revenue. If there is one, it is refunded back to taxpayers.
On the flip side of the equation, Oregon has the third highest income tax in the nation. Overall taxes in the state rank 16th in the nation as a whole at $3,861 per capita annually.
Additionally, there are property taxes. It’s an odd system that likely needs reform and operates in a way that causes inequality for taxpayers. This article explains the system, giving you an idea of what to expect when you’re considering both a home and neighborhood.
How do property taxes in Oregon work?
This three and a half minute video by the Oregonianexplains the situation concisely. We’ve also summarized a short history in writing for you to reference.
Timeline for property taxes from 1990 to now:
- Until 1990, property taxes in Oregon were calculated as they are in most of the country, via a percentage of the market value of your home. Oregonians thought this was too high.
- In 1990, Measure 5 was passed in an attempt to lower taxes.
- Measure 5 capped property taxes at 1.5% of the property’s market value. As property values began to climb, this cap still wasn’t enough. Taxes became too high once again.
- In 1997 measure 50 was passed. This is Oregon’s current property tax law and it completely changed the way taxes are calculated.
- Measure 50 calculates property taxes by taking the 1995 value of your home, subtracting 10 percent, and then adding 3 percent per year until the present. The number created is called the home’s Maximum Assessed Value (MAV).
- 1995 value of home – 10% + 3$/year = MAV
- If you have a new home with no ‘95 value, your home’s MAV is calculated using other similar properties in the same county. The 3 percent increase per year still applies.
- Measure 50 calculates property taxes by taking the 1995 value of your home, subtracting 10 percent, and then adding 3 percent per year until the present. The number created is called the home’s Maximum Assessed Value (MAV).
- The basic premise of the law is that your property’s value will rise faster than its MAV, thus generating lower taxes.
Here’s the issue:
In some neighborhoods, for example inner NE Portland, property values in 1995 (an arbitrary year chosen only because that was when the measure was initially created) were pretty low. Therefore, your taxes start lower when you begin accruing the annual 3 percent increase.
Property values in these areas have grown much more rapidly than in other neighborhoods. So, if you’re purchasing a home in a growing neighborhood, you’ll be paying pretty low taxes in comparison with the value of your home.
However, if you buy a home in the west hills, where property values have not grown as rapidly, you won’t be saving much on your property taxes as the MAV will more closely reflect your home’s current property value.
Why is this system unpopular?
In the two decades since the introduction of Measure 50, an unequal distribution property taxes has been created. If taxes were redistributed according solely to property values, 57 percent of property owners would see their taxes decrease.
Only 43 percent of homeowners save in the current property tax structure. Those that do are generally people who own homes in neighborhoods that have been rapidly gentrifying in recent years. Homeowners in neighborhoods with more steady home values pay higher taxes.
The bottom line is that because of Measure 50, tax bills for homes of equal property values are paying vastly different taxes — sometimes by thousands of dollars. These inequities are often burdened on poorer neighborhoods where tax increases more closely mirror property values. For example, a neighborhood like Kings Heights where property values have been high for many years (and taxes rise fairly parallel in relation) are paying taxes with a ratio similar to homes in neighborhoods where property value has been consistently lower. These correlating property value and property tax increases appear reasonable, until you consider a neighborhood like Sherwood where property values have recently soared and taxes remain relatively low.
Find your neighborhood, find your MAV
The Oregonian also created a handy interactive map to see how property taxes are distributed throughout Portland. The map imagines that property taxes are redistributed based on market value and then shows if a property pays more or less taxes than it would if rates were based solely on current market value.
Simply enter an address into the search bar to find out that property’s tax info.
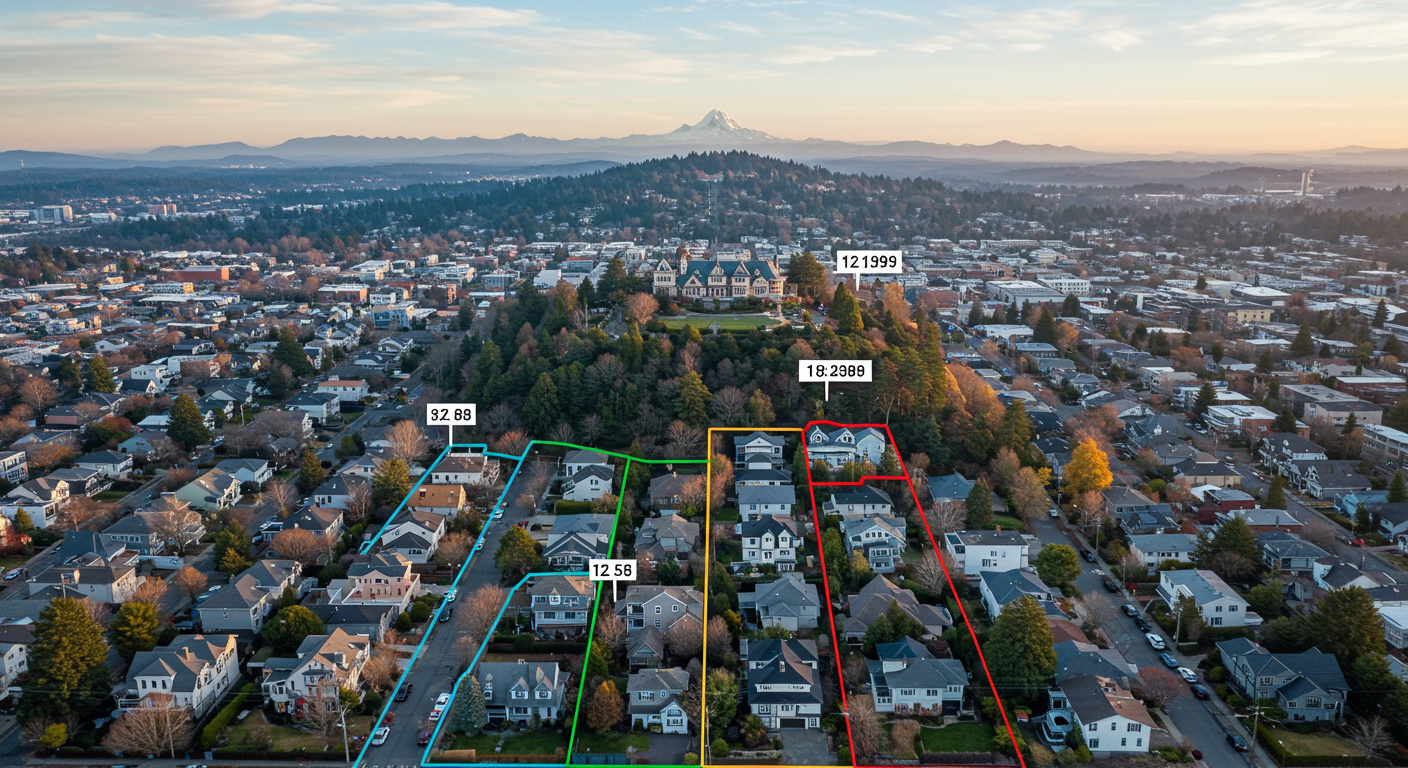
We used the Pittock Mansion for the example above, which obviously isn’t applicable, but you can see how the map works.
What’s on the horizon?
Oregonians are wary to change the tax structure. For one thing, 43 percent of taxpayers benefit from the current system, by no means an insignificant number of voters. Beyond that, those who are paying a higher share of taxes can be certain that taxes will rise at a slow and steady rate.
There is currently a resolution in the Oregon Senate that seeks to essentially return property tax calculation to the previous method of determining a home’s value via real market value. It would level out property taxes across the board, which means higher rates for some. Commercial properties and rural communities might end up with higher burdens as lawmakers try to even distribution through tailormade reform. You can learn more about the situation inthis article.
Though many Oregon voters stick to the current system for, tax reform is always a possibility. It is definitely worth keeping an eye on as a homebuyer or seller. This resolution will be voted on in a 2017 session, you can track it here.
Portland tax climate
The Oregon tax structure as a whole creates both opportunities and problems for Oregonians. On the one hand, the lack of sales tax and excise tax creates a healthy climate for business growth. Oregon was ranked as the 12th best state to start a new business in a 2015 study by the Tax Foundation.
On the other hand, the tax situation in Oregon has created trouble for the state when it comes to funding vital social and state services such as education and law enforcement. Property taxes are used to pay for public schools, which have long been considered underfunded. In most states, income tax is used to pay for education, and this generally creates more stability as income tax fluctuates less than property tax.
These discrepancies in Oregon’s tax structure have led to studies that compare Oregon’s tax structure with those of nearby states to see how our system stacks up.This article by KUOW News in Seattle compares Washington (no income tax, high sales tax), Idaho (sales tax and income tax) to Oregon. It’s an interesting read, showing that while Oregon’s method of foregoing sales tax means we collect more tax dollars, our system has a lot less stability overall. In Oregon, if you’re not working, you’re not in the tax system.
Oregonians refused to institute a sales tax even after the Recession left the state near bankruptcy, proof that we are slow and careful to alter our tax climate. It’s an attitude to consider when you’re researching the future of property taxes for any near or long term real estate investments.
As always, if you have questions or feedback, let us know!
Resources:
Lawmakers Seek to Unwind Parts of 1990s Property Tax Revolt
Tax Breaks for Gentrifiers: how a 1990s tax revolt has skewed the burden for tax payers
Video: A brief history of Oregon’s property tax system
Map: Measure 50 Winners and Losers
How Oregon’s taxes stack up (2015)
Washington and Oregon Have a Tax Off. Who Wins?